Nobody was looking at who was going to get hurt.

Week 1, 1991. Randall Cunningham's knee goes out on the first play of the second quarter, taking my entire year with it. I didn't lose because I scouted performance wrong. I lost because nobody was even asking the injury question.

Thirty-five years later, here is the tool I wanted that morning. Every NFL player, scored 1 to 100 "Frailty Score" for how likely they are to break down this season. Ironman at the bottom. Glass at the top. Type a name and find out.

No account. No card.

Pick a Player.
See the Risk Score.

Try 5 free picks — search any NFL player, get a real frailty report. No account, no card.

Free Sample Picks
Search any player · see their full frailty report · 5 picks remaining
What's Inside

Full Featured Interface

This is what you get after signing up. Live data, real players, updated continuously.
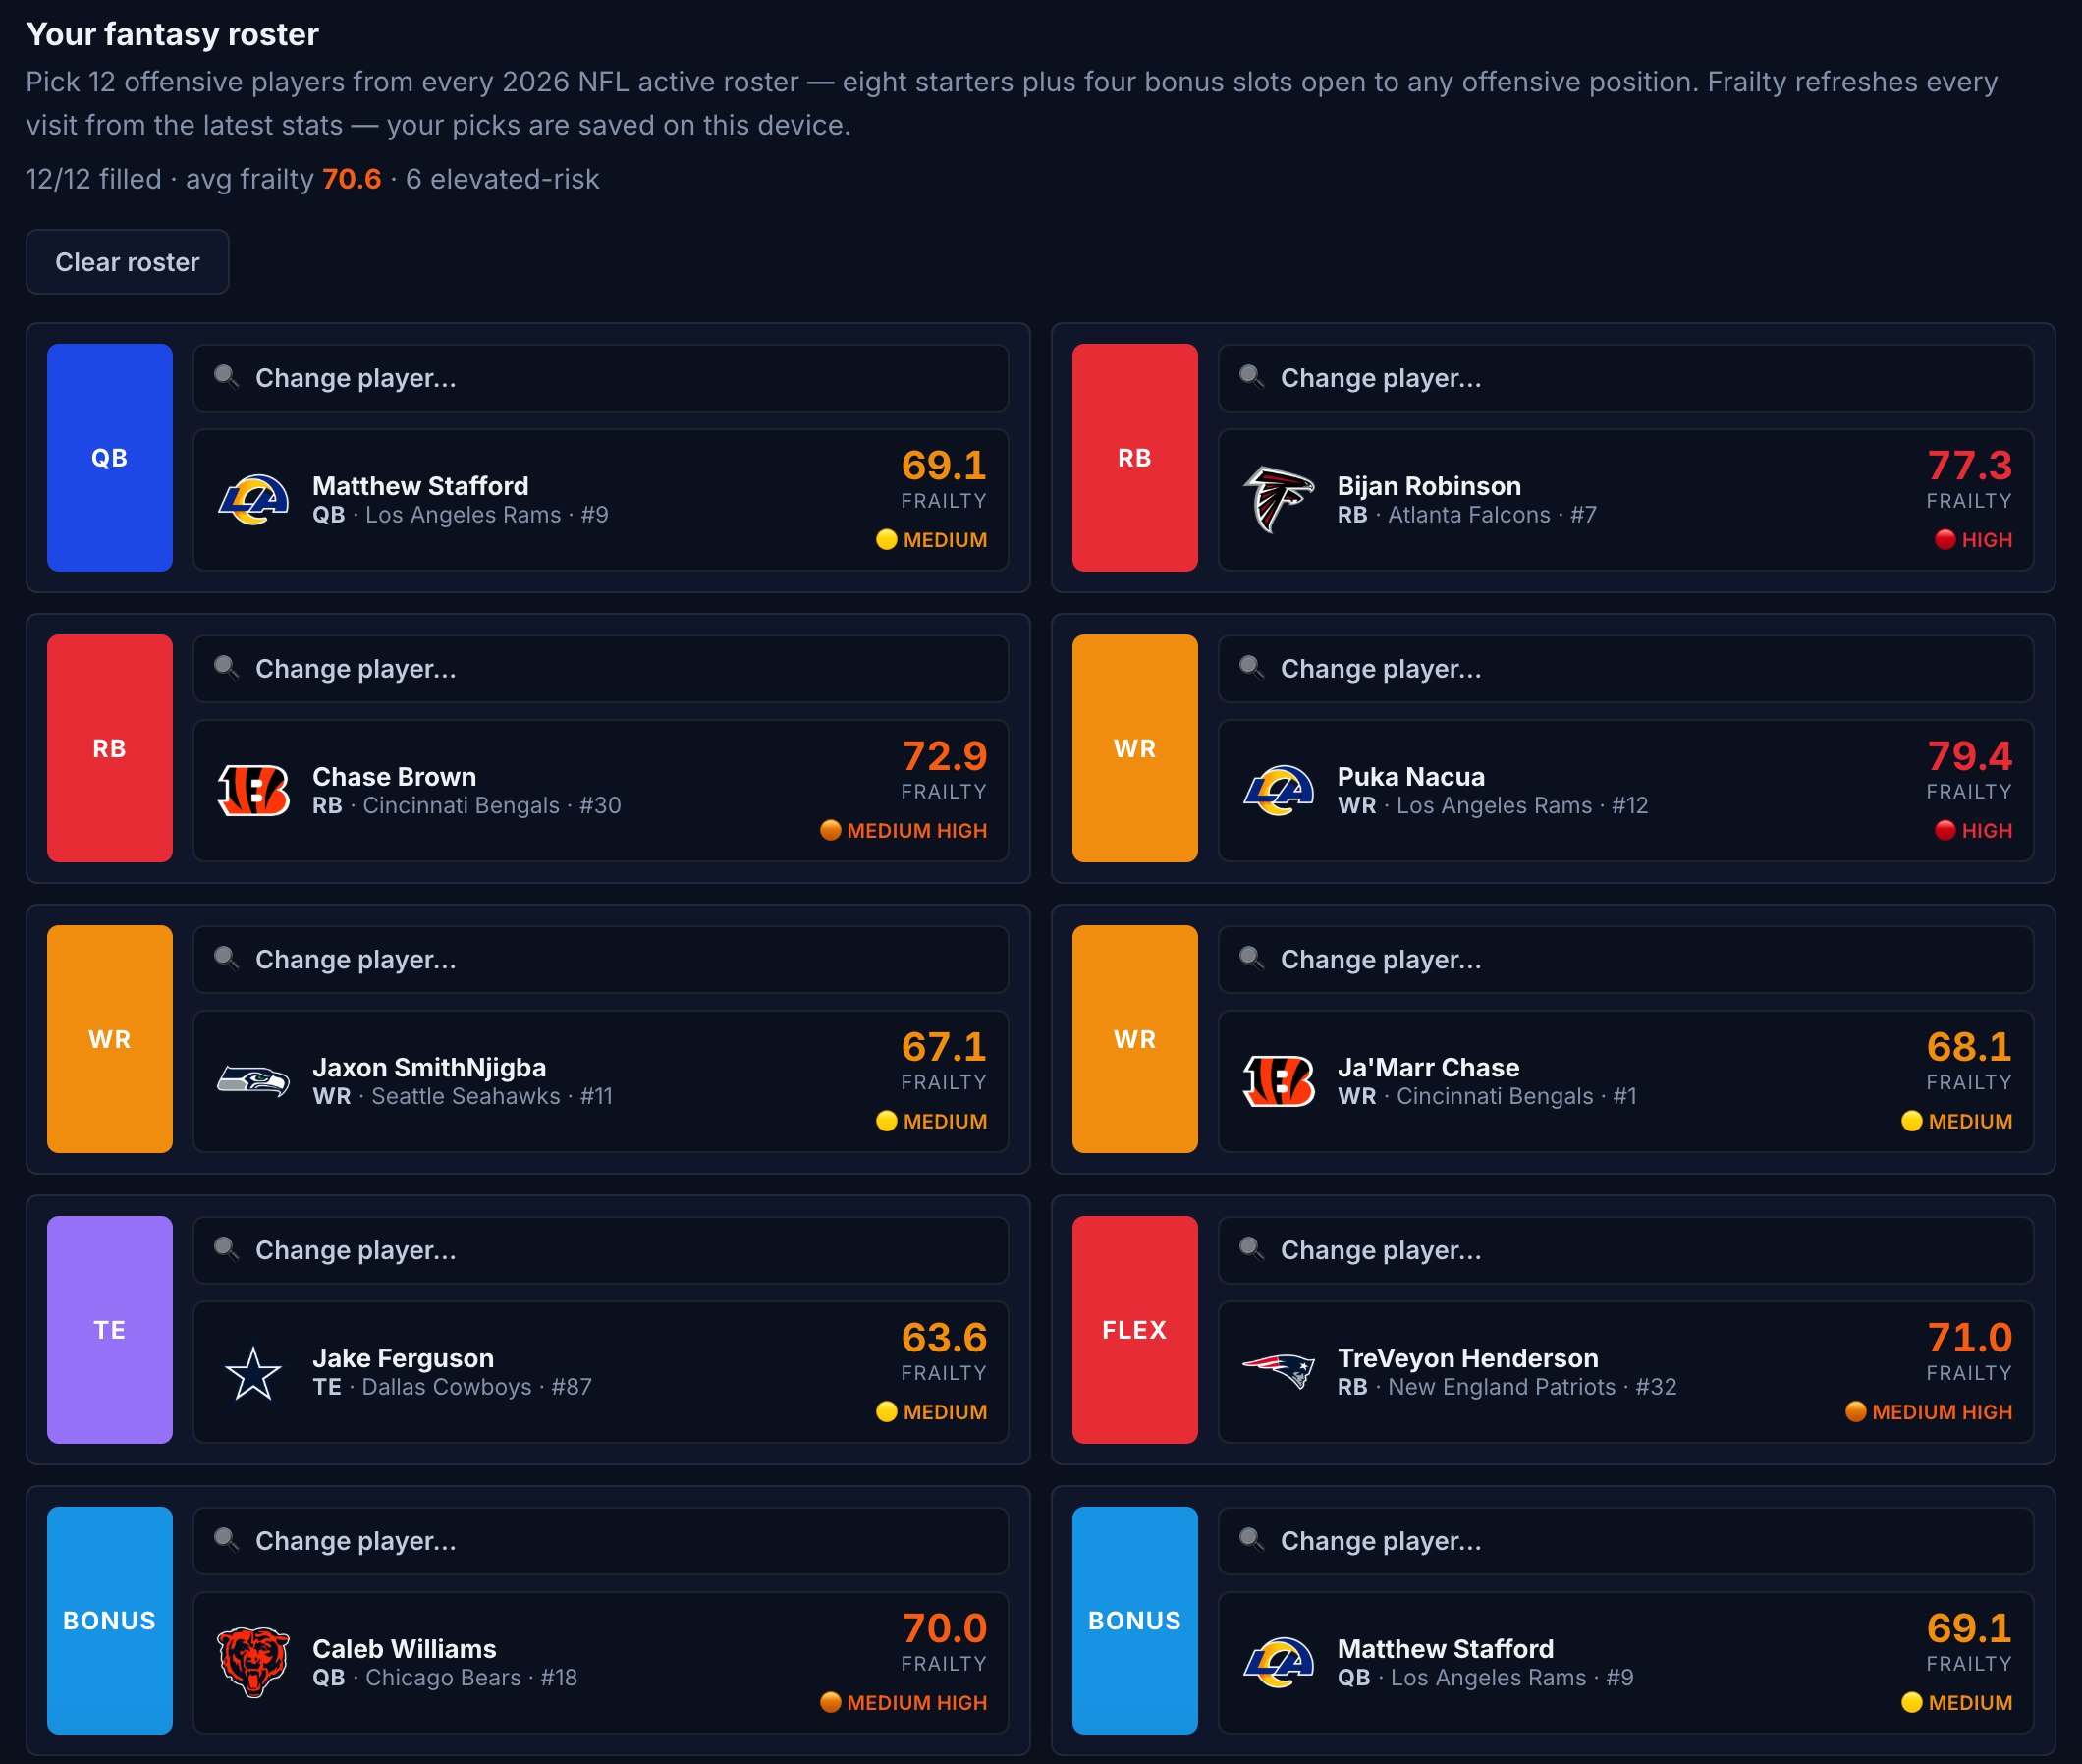
Fantasy Roster Risk Dashboard
Featured
Fantasy Roster Risk Dashboard
Build your 12-player fantasy lineup and watch the aggregate frailty score update in real time. Spot weak links before they cost you a week.
2,900+ Players Scored Every player on all 32 teams — skill positions, offensive line, and defense — ranked and kept current.
Six Risk Tiers Ironman to Glass, calibrated per position. Elevated-risk players miss time at ~1.7x the league injury rate.
Full Frailty Reports Every player gets a detailed report — frailty score, position context, injury history, and durability forecast.
Live nflverse Data Rosters and stats refresh from the official nflverse feed. You're always looking at current data.
Get Full Access — $39/Season
Available Now
Risers & Fallers
Frailty moves during the season — risk rises and falls as real-game data streams in. Track which players are trending up or down week to week, included in your plan with no upcharge.
Premium Feature
Game-by-Game Overalls
Frailty projected per matchup on every game. See the risk picture before kickoff — set lineups, fade props, find edges the injury report won't catch until Sunday morning.
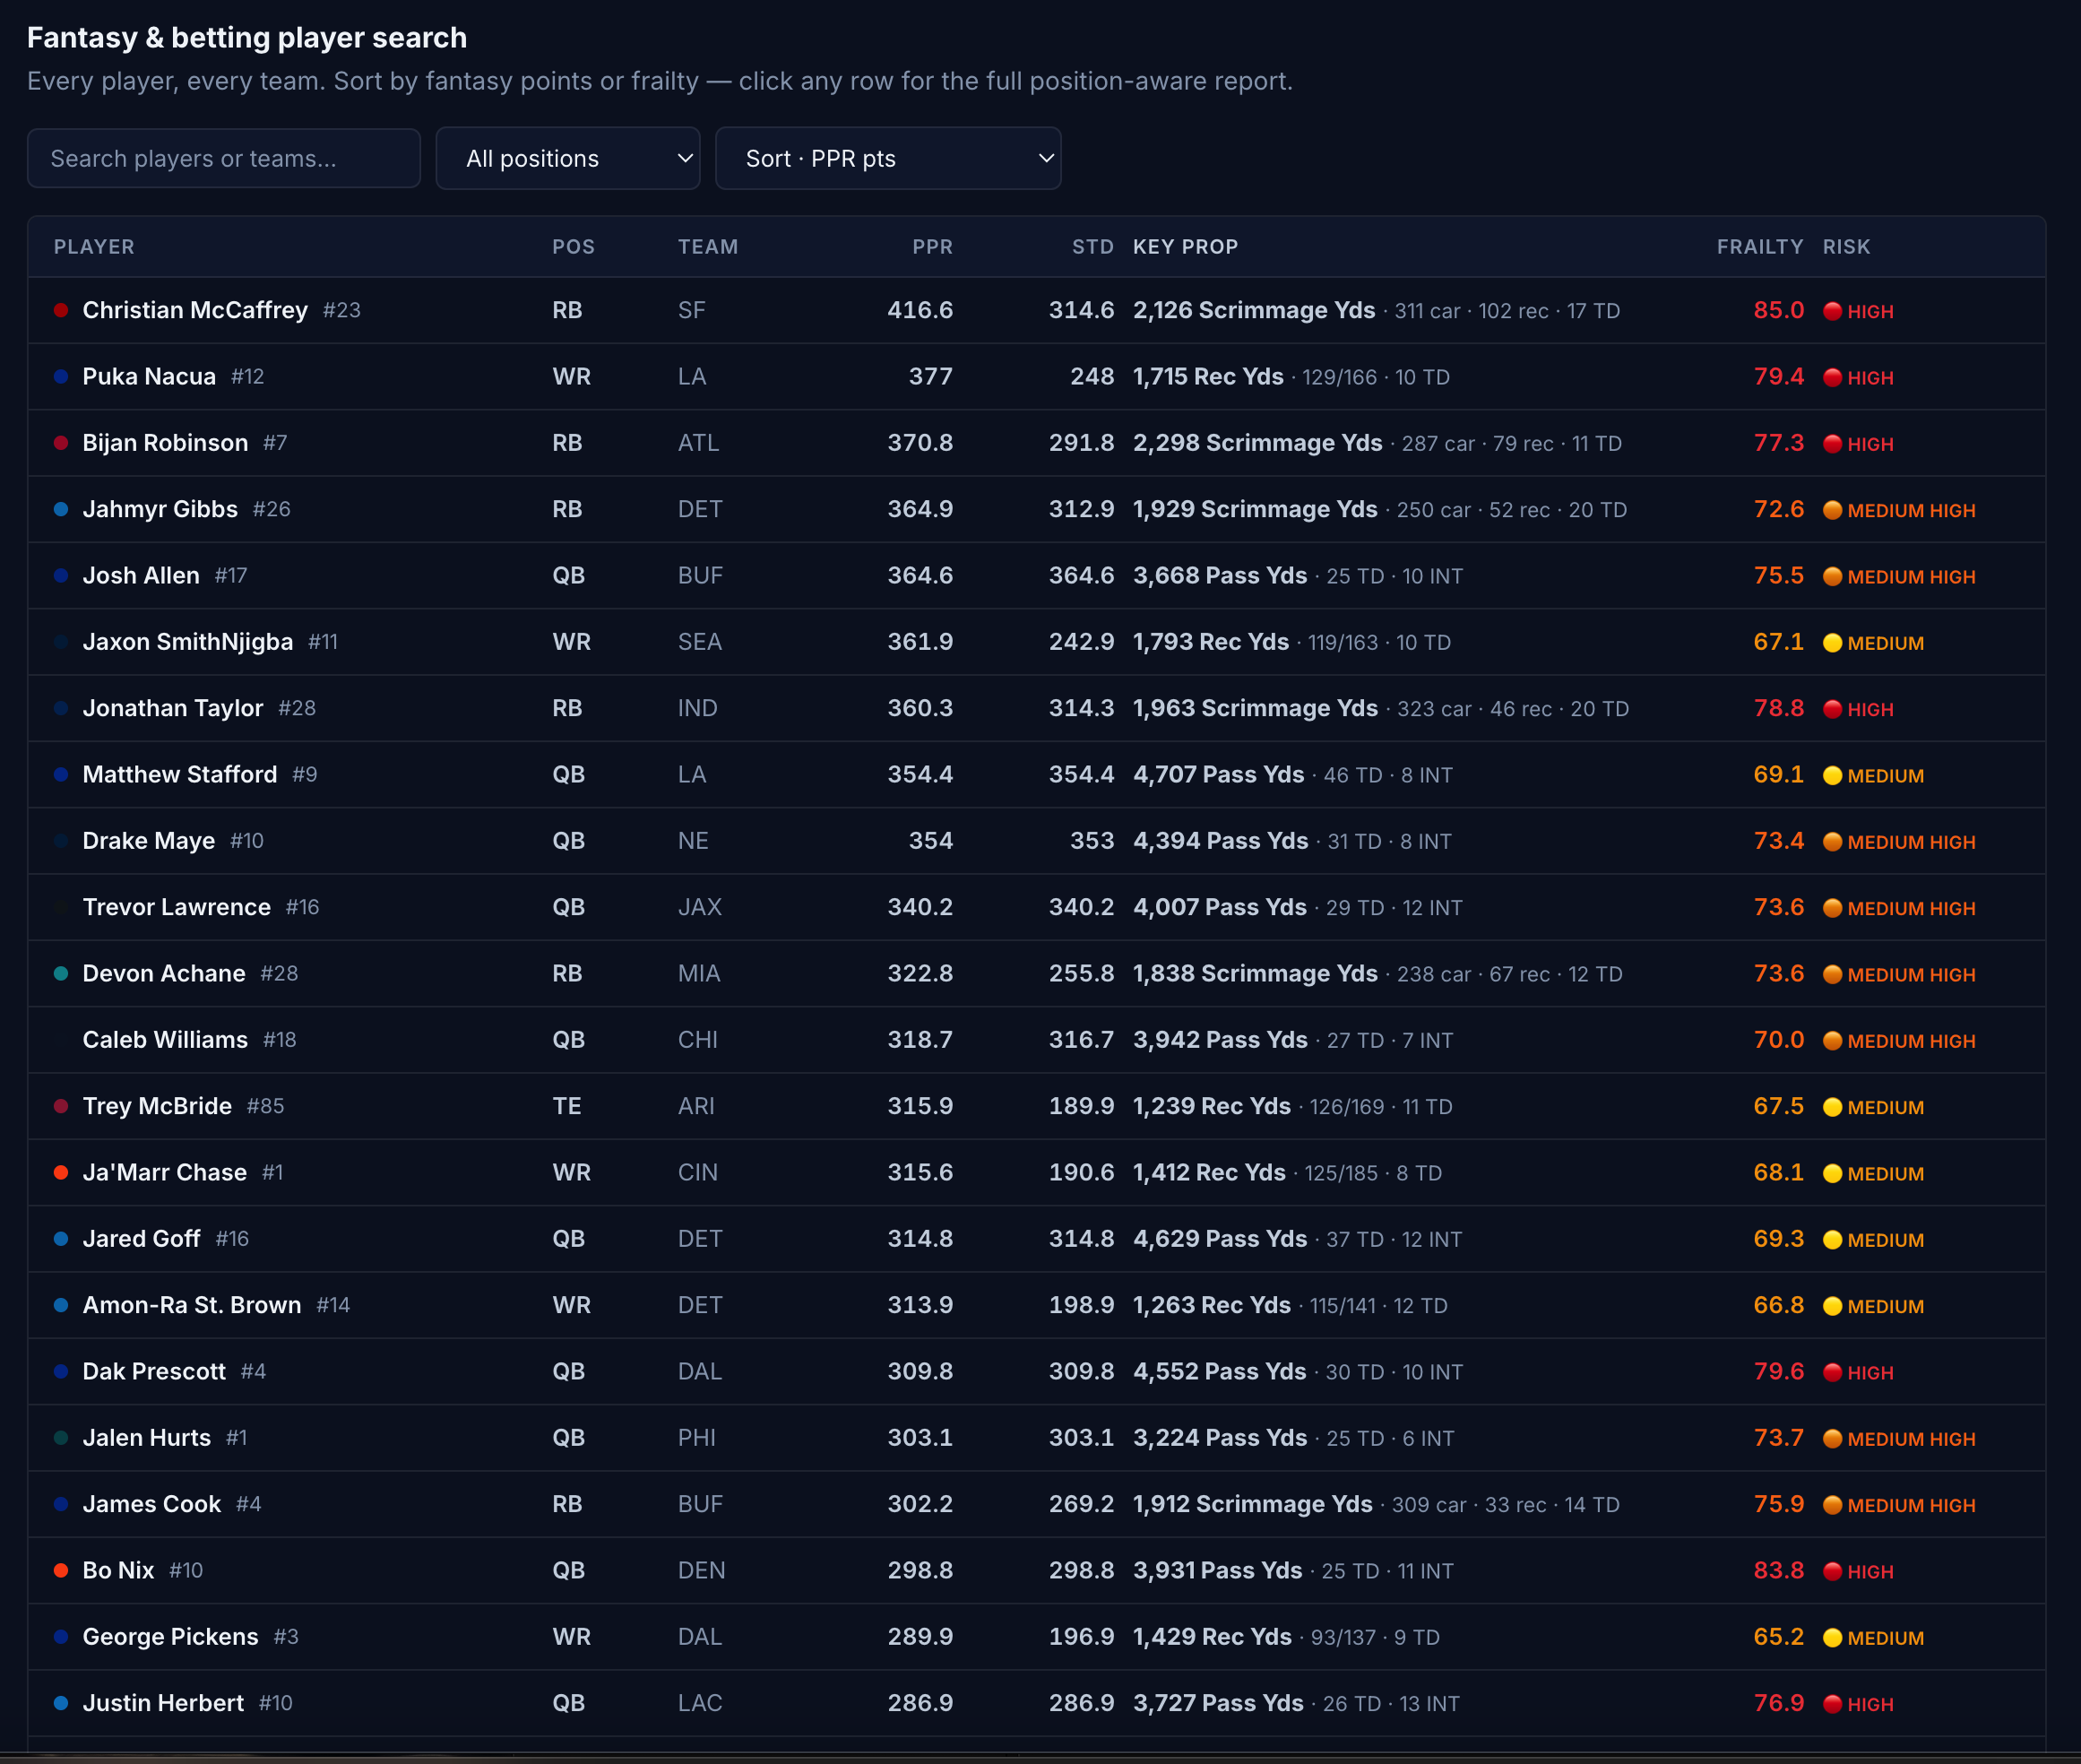
Complete NFL Player Risk Assessments

Complete Player Assessments

Position-aware frailty scores for every rostered player — offense, OL, and defense. Sort, search, and compare across the entire league.
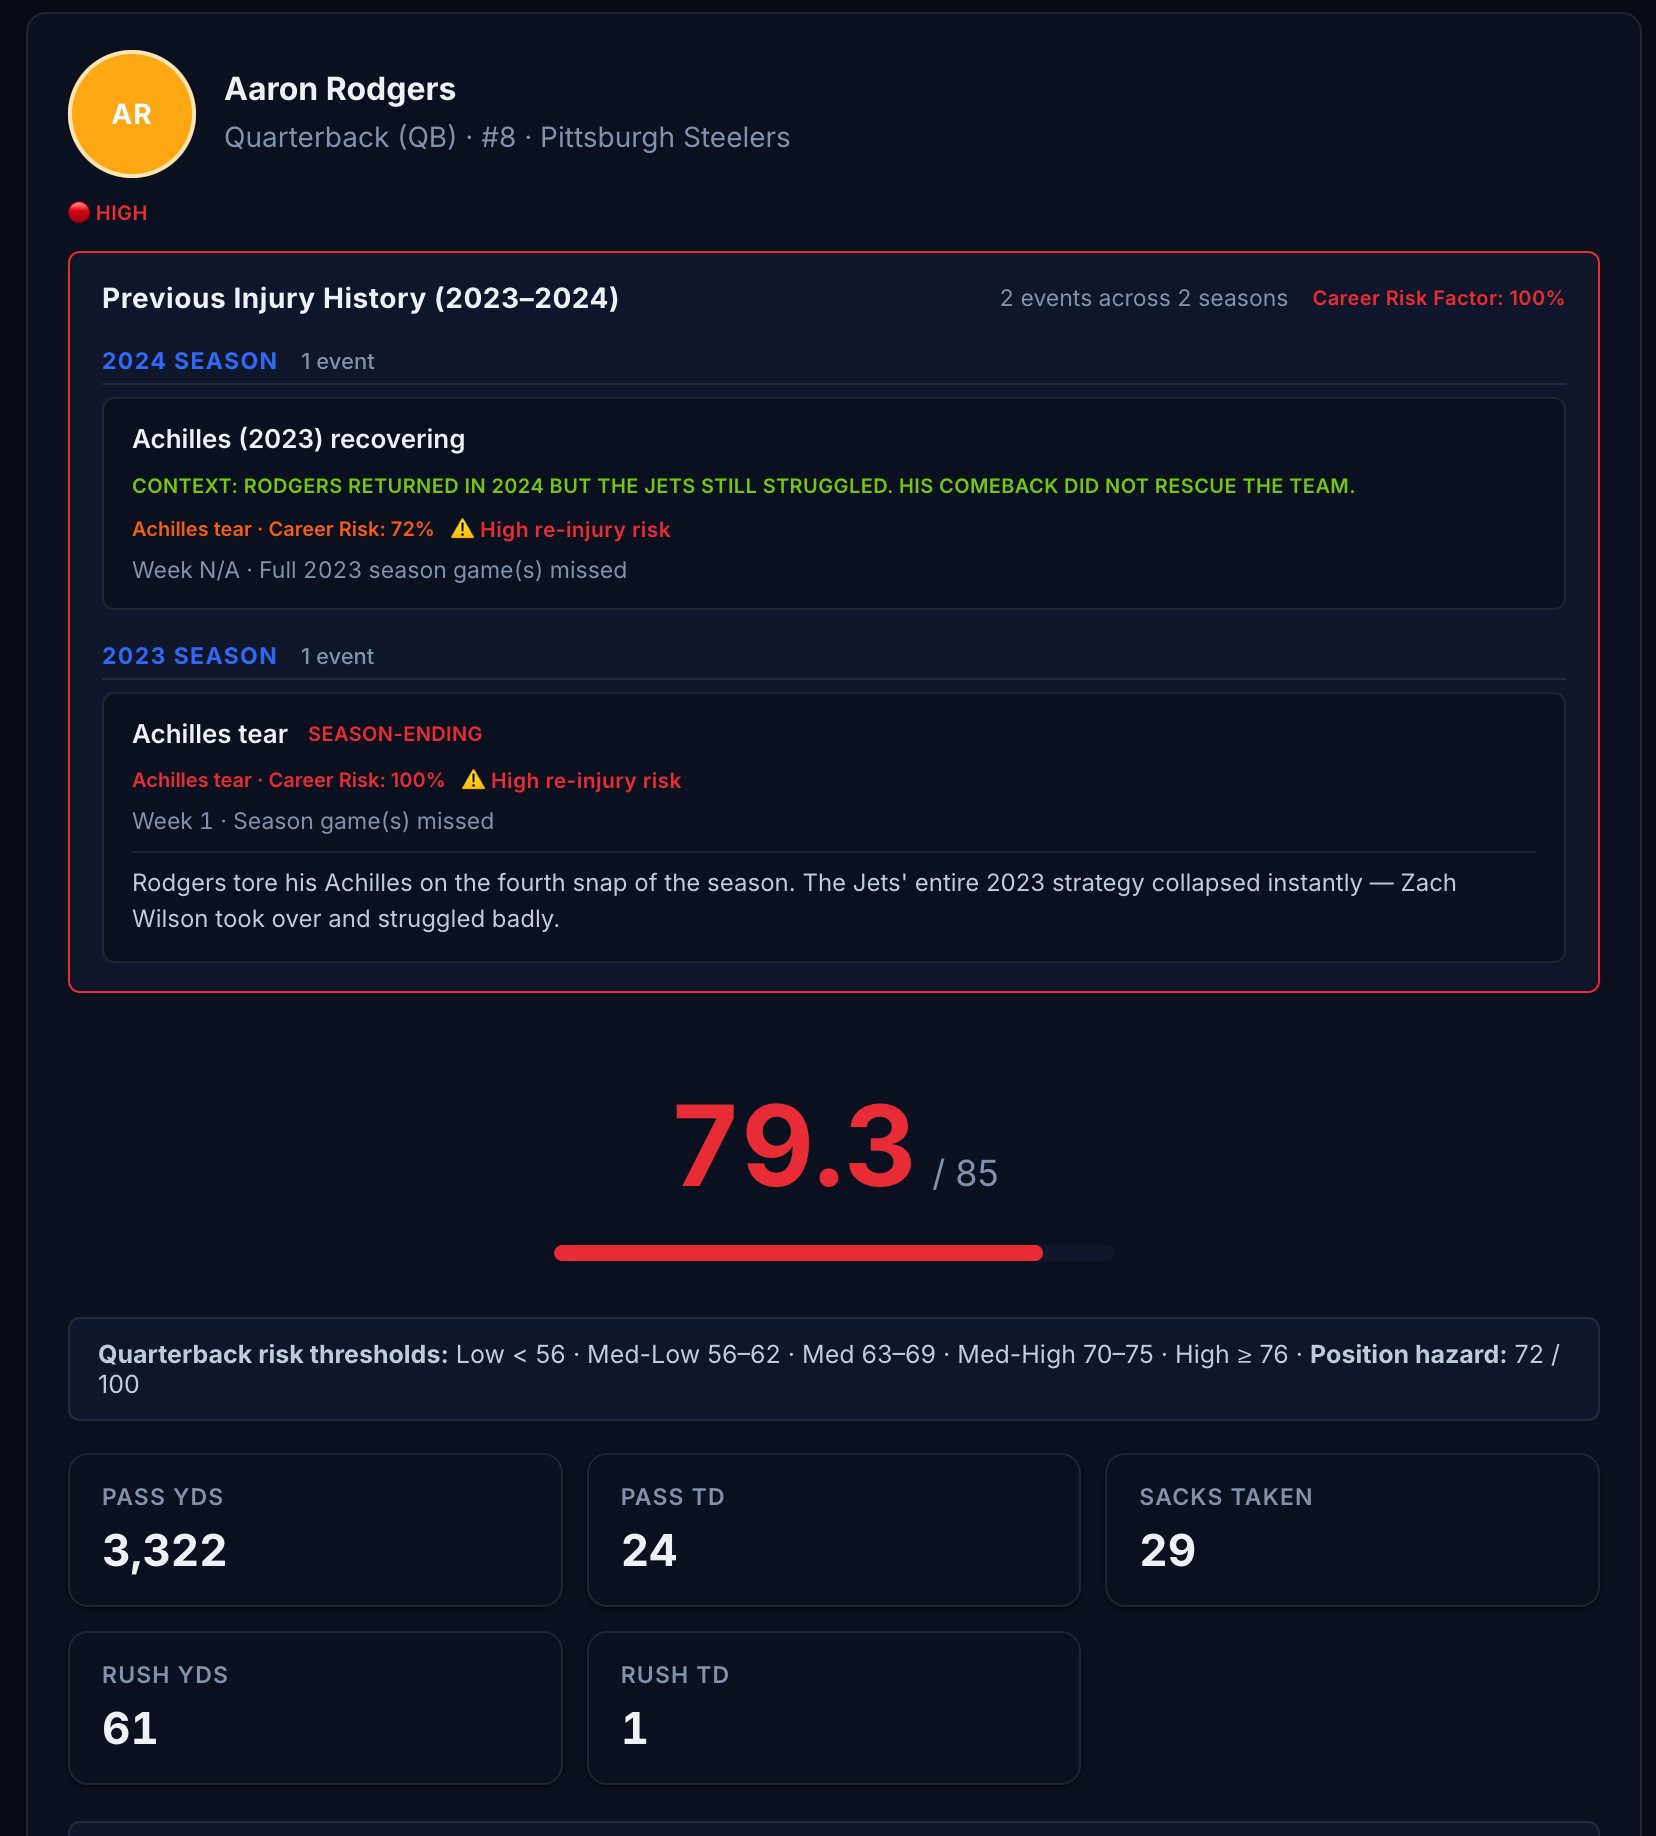
Detailed Risk Assessment Reports

Detailed Risk Reports

In-depth breakdowns with injury history, workload analysis, position context, and actionable durability forecasts.
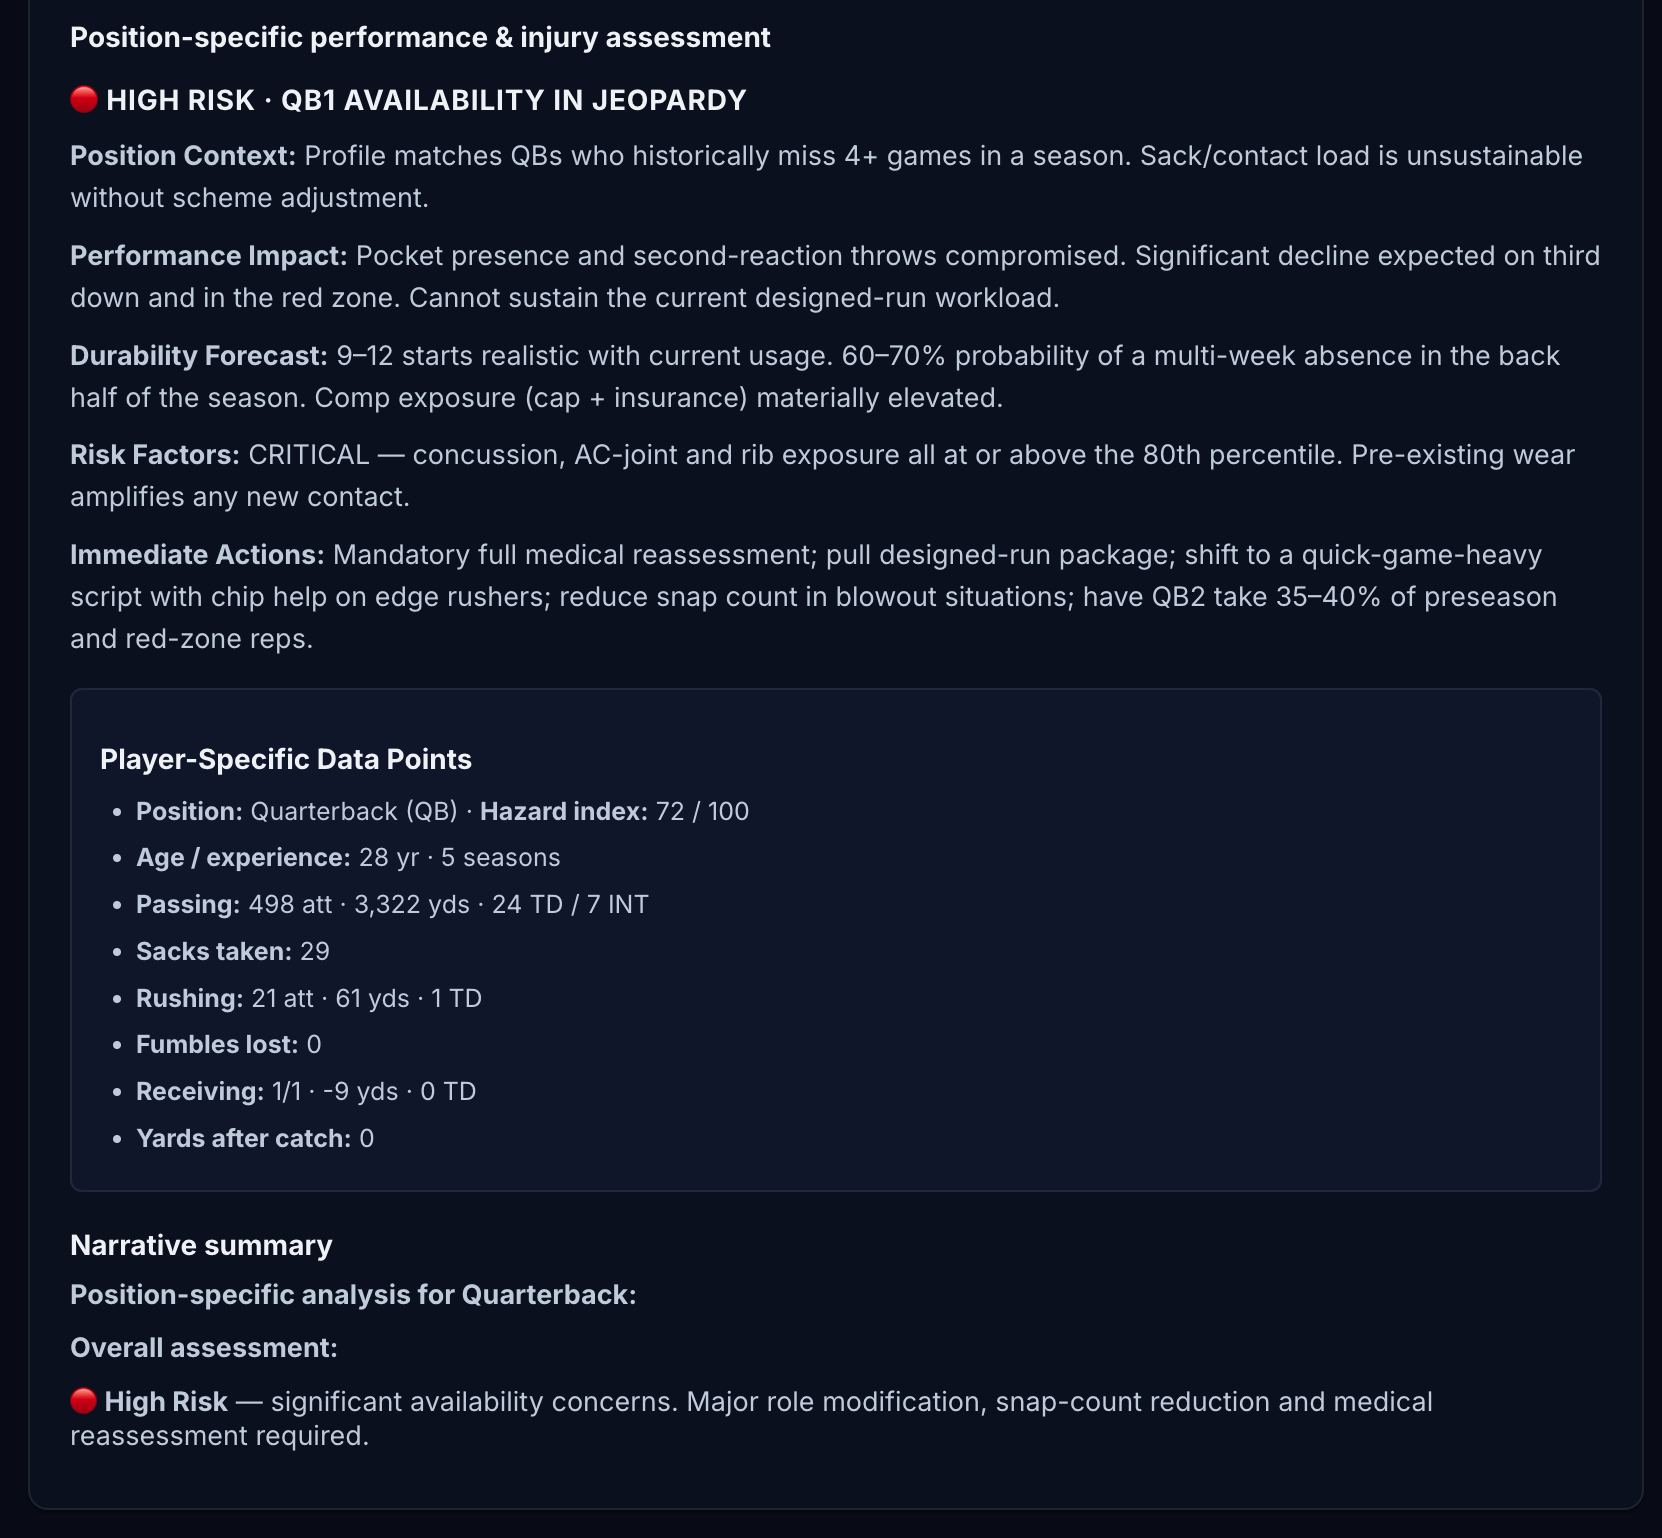
Industry-Leading Data

Industry-Leading Data

Historical data from 2000–2026 informing the model. Weekly stat refreshes keep your edge sharp all season long.

Everyone knows when a player is hurt. Nobody sees it coming.

By the time ESPN flashes that injury update, the prop has closed, the DFS lineup is locked, and your trade window is gone. You're reacting to news alongside the crowd instead of managing risk before it materializes.

Sportsbooks price the past
Player props are set off recent production and public news — not forward-looking durability. Yet elevated-risk players get hurt at ~1.7x the league rate. That gap never makes it into the line.
Lagging odds
Fantasy platforms show zero risk signal
Rankings and projections tell you what a player did last week — nothing about whether that 20-touch workhorse RB survives Week 8. 78% of 2025's injured players were rankable in the top half of the risk distribution before the season even started.
No forecast
Injury news arrives too late
Analysts work from public practice reports and official designations — information the entire market sees the second it drops. By the time the report posts, the edge is already priced in.
Priced in

Everyone else tells you
how to win.
We show you how not to lose.

Use your own rankings, your own picks. INJSUR sharpens your decisions — it doesn't replace your judgment.

Accuracy
~1.7x the injury rate at elevated risk. Validated on the 2025 holdout.
Calibrated on 2024 injuries, validated against the unseen 2025 set — 72% ROC-AUC, ~1.7x the league baseline at elevated risk. Every number recomputable from the 2025 Results tab.
Similarity
Most other sites and apps are 90% the same.
They repackage public injury reports and call it analysis. They show you what already happened — not what's about to.
Pricing
$39/season or $99 for life. No tiers, no upsells, no auto-renew.
Less than one bet for the season. Less than the change in your couch for a lifetime. Every Pro feature ships free to all subscribers — we add value, not fees.
Dirty Little Secrets
The full breakdown — with receipts.
We've got about 10 dense, robust data points — competitor pricing comparisons, methodology breakdowns, validation details. Way too much for a home page. Sign up and check the full Learn More tab for every comparison, every data point, every receipt.
See the dirty little secrets →

We've got you covered with 7 different ways.

DFS cash games, prop betting, draft day, dynasty, futures, auction — same frailty score, different edge depending on your game.

Explore all 7 use cases →
INJSUR is a decision-support tool. Past backtest accuracy does not guarantee future results. Use our data alongside your own research — we're here to sharpen your edge, not make decisions for you.

A durability score for every player, before the season starts.

Our proprietary algorithm scores every skill-position player on a 0–100 frailty scale. Higher score = higher injury risk. Built from workload, contact rate, age, injury history, and positional hazard data — not expert opinions or medical reports.

Player Rankings
2,900+ Players Scored
Every player across all 32 NFL teams, scored and ranked with position-aware calibration. QBs through defensive backs — no blind spots.
Multiple Indicators
Risk Tiers
Ironman, Steel, Oak, Chipped, Cracked, Glass — six tiers that read like a scouting report, calibrated per position. Elevated-risk players miss time at ~1.7x the league baseline injury rate.
Your Roster Dashboard
Full reports on your picks!
Build your exact fantasy lineup. Aggregate frailty updates in real time as you swap players — identify weak links before injuries cost you a week.

The model

A logistic-regression and neural-network ensemble informed by 25 seasons of NFL data (2000–2026), weighting each player's notable-injury records from the last five seasons (2022–2026) most heavily. It scores every player based on our trained model output across 20 features: position-specific hazard rates, cumulative workload (carries, targets, sacks, tackles), contact rate, negative-play frequency, YAC exposure, age, experience, and five recency-weighted injury-history variables. This creates a robust, accurate, world-class predictive algorithm that is self updating and can score any player even if it has never seen them before simply based on their stats.

No peeking

The model never sees player names, team IDs, or outcome labels from the season it's predicting. Calibrated on the 2024 injury set, evaluated against unseen 2025 outcomes — 72% ROC-AUC, fully reproducible.

Real Bettor Outcomes

We scored every 2025 roster pre-season using only pre-2025 data, then checked how those scores sorted against the injuries that actually happened — out-of-sample, on a season the model never saw.

Out-of-sample · 2025 holdout
72% ROC-AUC
Every player was scored using only pre-2025 features — no 2025 outcomes, names, or IDs leaked in. The model ranked the injured player higher 72% of the time. See the full backtest →
Top-20% Capture (2025 holdout)
32%
The riskiest 20% of the pre-season ranking accounted for ~1/3 of all 2025 missed-game injuries — roughly 1.6× a random 20% slice.
Elevated-Risk Tier Lift
1.7×
Players flagged elevated-risk missed time at ~1.7× the league base rate in 2025.
Top-half recall (2025 holdout)
78%
78% of 2025 injured players ranked in the top half of the risk distribution before the season — the durable half produced just ~1 in 5 injuries.

Full honesty: 72% ranking accuracy still leaves 28% of injured-vs-healthy pairs misranked, and no model can predict a purely random contact injury. We publish the real out-of-sample numbers — recomputed live on the Results tab — not cherry-picked ones.

What the model saw
before anyone else.

We fed every notable 2025 injury through INJSUR's pre-season model and asked a simple question: could you have seen it coming? In most cases, the answer was yes.

Out-of-sample · 2025 holdout
72%
ROC-AUC
Ranking accuracy on the unseen 2025 set

Across every (2025-injured · healthy) player pair, the model ranked the injured player higher 72% of the time — using only pre-2025 features. Coin flip is 50%; this is a real, reproducible edge.

Elevated-Risk · 1.7x tier lift
1.7×
tier lift
The risk tier you can act on

Players flagged elevated-risk missed time at ~1.7× the league base rate in 2025 — about 1 in 3 flagged players vs ~1 in 5 league-wide. That gap never makes it into the line.

Concentration
32%
top-20% capture
The riskiest 20% = a third of injuries

The top 20% of the pre-season risk ranking accounted for 32% of all 2025 missed-game injuries — roughly 1.6× what a random 20% slice would catch. That's the tier to hedge.

Separation
78%
top-half recall
The durable half is the safe half

78% of 2025 injured players ranked in the top half of the risk distribution before the season — the durable half of the league produced just ~1 in 5 injuries. See the full backtest →

One season. One price.
All The Edge.

Every tool, every team, every player — unlocked. No tiers, no upsells, no auto-renew.

Pick Your Plan

One Price Gets Everything.

Same features on both plans. $39 for the season, $99 once for lifetime access.

Every plan includes
2,900+ Players ScoredAll 32 teams, every position, daily updates
Position-Aware Frailty ScoresCalibrated separately per QB, RB, WR, TE, defense & specialists
Full Player ReportsInjury history, risk factors, frailty driver breakdown per player
12-Slot Roster BuilderBuild your lineup, see aggregate risk, spot the weak link
Backtested & Validated72% ROC-AUC on the unseen 2025 injury set
Risers & FallersFrailty moves during the season — risk rises and falls as real-game data streams in. Track which players are trending up or down week to week, included with no upcharge.
Team-by-Team OverallsAggregate frailty for every roster — compare teams, spot fragile divisions, plan your season
Game-by-Game OverallsMatchup-level risk projections — know the frailty picture before kickoff, all season long
Ad-Free · No Auto-RenewNo ads, no spam, one-time payment
2026 Season Pass
$39 / season

Full access for the entire 2026 NFL season — every team, every player, every week.

Less than one bet for the season.

72% ROC-AUC on the unseen 2025 holdout. Full validation and competitive comparisons available.

See Accuracy & Validation →

Pro Features Coming Soon.
Every Subscription Upgrades Free.

Lock in your subscription now and get every Pro feature as it ships — no upsells, no add-on fees. Here's what's on the roadmap.

Pro · Unlock at Launch
Watchlist
Pin your guys. One place to track every player you're monitoring across fantasy, betting, and dynasty — frailty updates on every visit.
Subscribe now — it's included when it ships →
Pro · Unlock at Launch
Social Widgets
Shareable frailty cards, player comparisons, and trend snapshots — built for Twitter/X, Discord, and group chats. Post your edge.
Subscribe now — it's included when it ships →
Pro · Unlock at Launch
Game vs. Game
Every matchup, every week. Click any game to see the full frailty breakdown — skill groups, individual players, live odds overlay.
Subscribe now — it's included when it ships →
Pro · Coming Soon
IDP & Team Defense
Individual defensive players in your fantasy lineups — DL, LB, and DB frailty-scored slot by slot, plus DK/FanDuel team DST units.
Subscribe now — it's included when it ships →
Pro · Coming Soon
Trade Analyzer
Compare two sides of any trade — see the frailty delta, projected games played, and durability edge between what you give and what you get.
Subscribe now — it's included when it ships →
Pro · Coming Soon
Lineup Optimizer
Input your salary cap, scoring format, and positional requirements — get an optimized lineup that maximizes PPR while minimizing injury exposure.
Subscribe now — it's included when it ships →
Pro · Coming Soon
NBA · Basketball
The same frailty model, ported to the NBA. Every player scored for load management risk, soft-tissue exposure, and minutes durability across an 82-game season.
Subscribe now — all sports included →
Pro · Coming Soon
MLB · Baseball
Frailty scoring for every MLB player — pitcher workload, position-player durability, and IL risk across a 162-game marathon. Built for daily fantasy and season-long.
Subscribe now — all sports included →

Have ideas for more awesome features? Email us. We'll process them and build them straight into Pro as we build this together.

info@injsur.app

One score.
Every game.

The same frailty score powers every format — DFS, props, season-long, dynasty. See how the model works and how to apply it to the games you already play.

Who is about to cost you a week?

The players who produce the most points, but carry the highest risk of breaking down. That's the list. That's the whole product. It updates every week.

Loading live GLASS-tier scores…
Score Any Player Free
"I didn't lose because I picked wrong. I lost because nobody was even looking at who was most likely to get hurt. Thirty-five years later, I built the thing I wish I'd had that morning."

Built by an avid fantasy football player and bettor with 35 years in the game. Not a hedge fund, not a chatbot. Read the full story →

Newsletter

NFL injury insights,
straight to your inbox.

Daily frailty score updates, key injury trends, and research notes. No spam — unsubscribe anytime.

We respect your privacy. Unsubscribe at any time. No spam, ever.

Got questions?

Coverage, validation, updates, pricing — everything you need to know, answered in one place.

Read the full FAQ →
$39/season · $99 lifetime

Stop Leaving Edge
On The Table.

Type any name, see the frailty score. No account, no card. When you're ready, lock in the full season for $39 — or pay $99 once for lifetime access.

Try 5 Free

INJSUR is a decision-support tool. Past backtest accuracy does not guarantee future results. Please play and wager within your limits.